(function(i,s,o,g,r,a,m){i['GoogleAnalyticsObject']=r;i[r]=i[r]||function(){ (i[r].q=i[r].q||[]).push(arguments)},i[r].l=1*new Date();a=s.createElement(o), m=s.getElementsByTagName(o)[0];a.async=1;a.src=g;m.parentNode.insertBefore(a,m) })(window,document,'script','//www.google-analytics.com/analytics.js','ga'); ga('create', 'UA-41959290-1', 'smarthive.com'); ga('send', 'pageview');
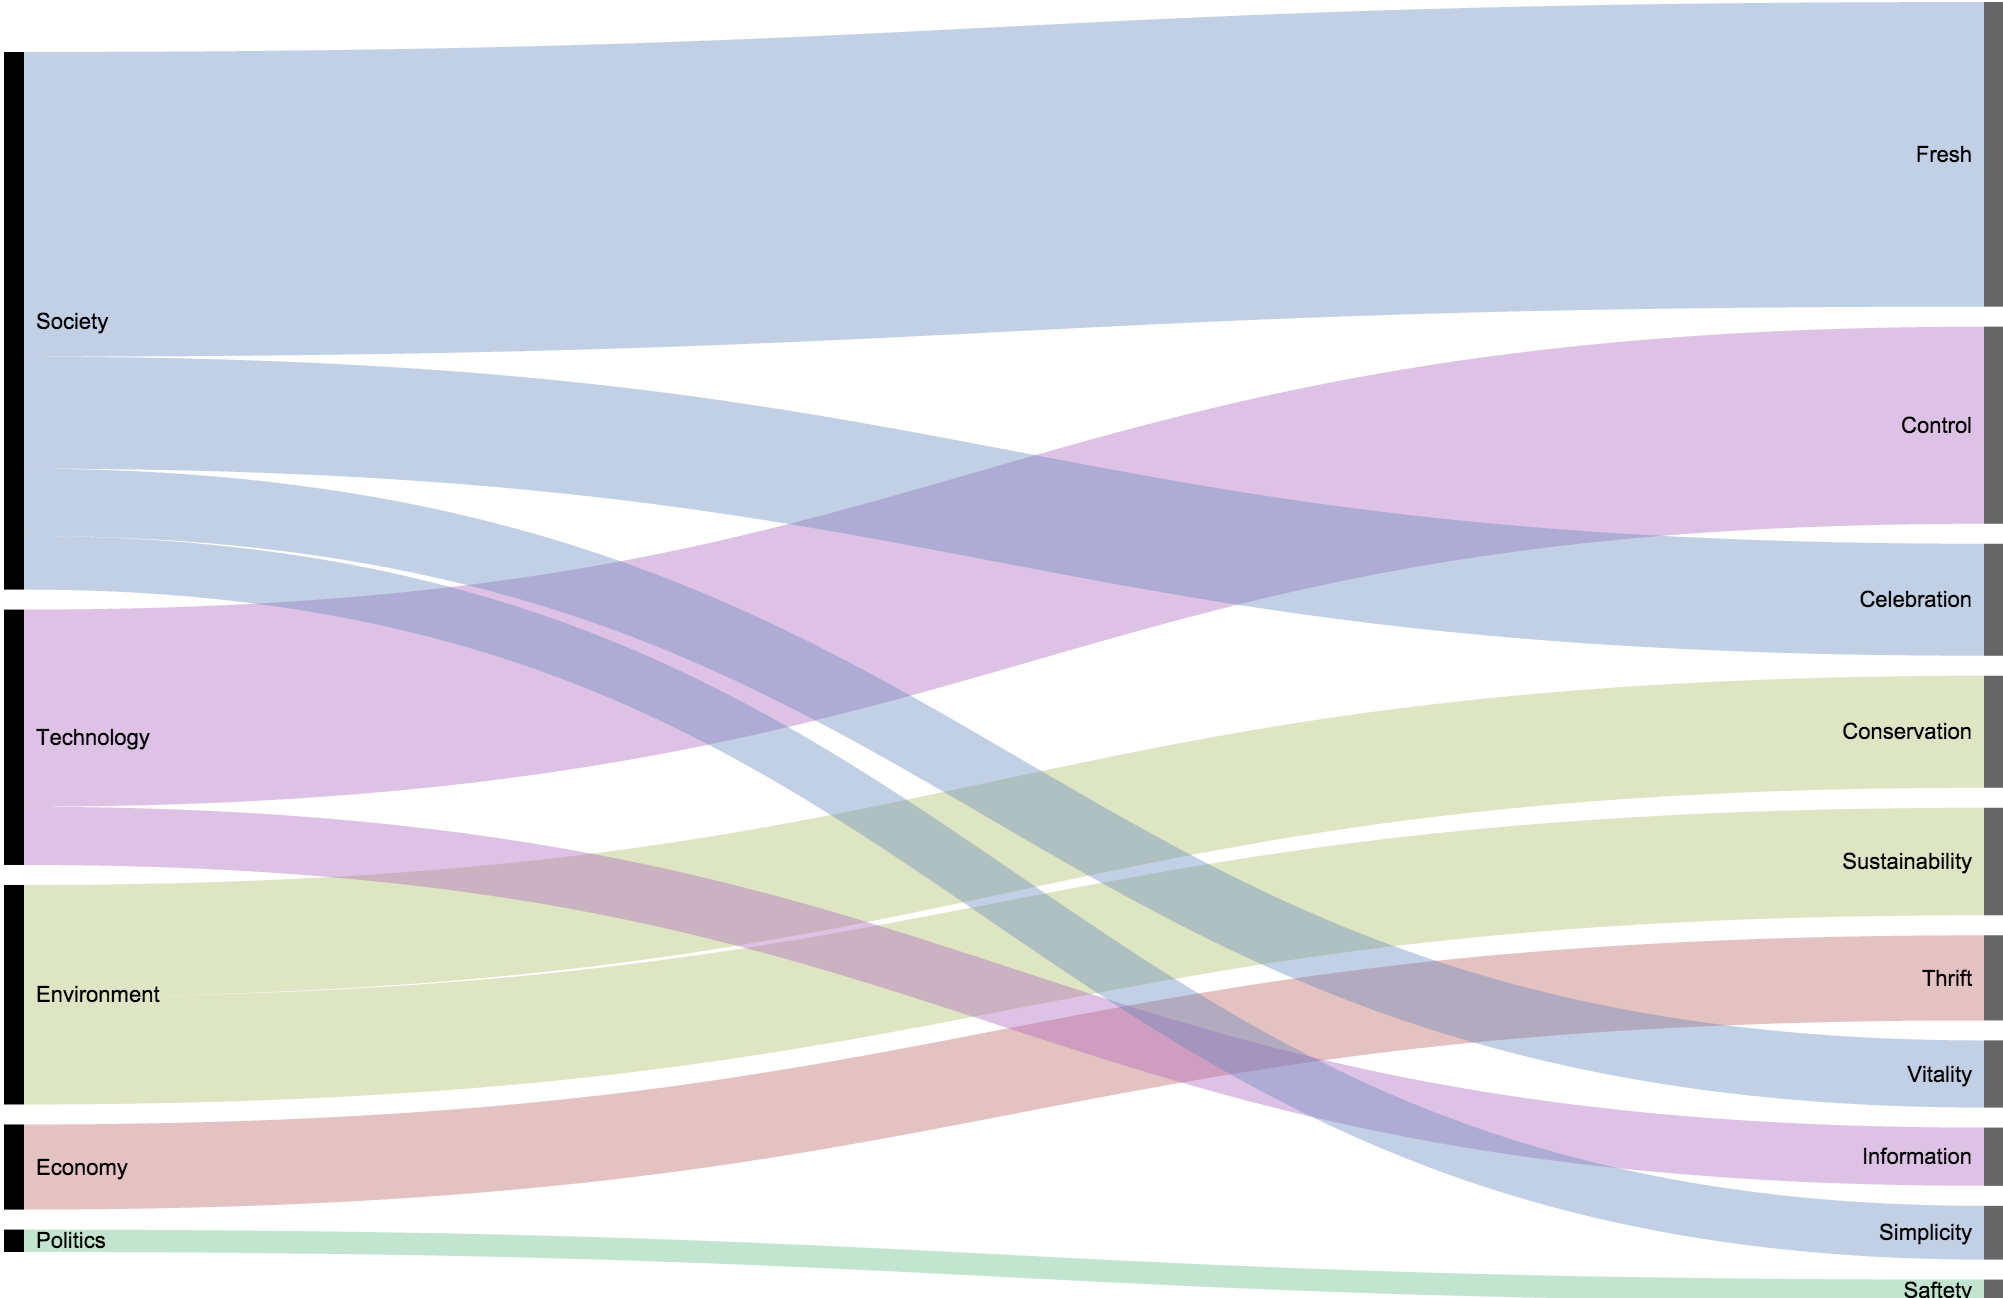
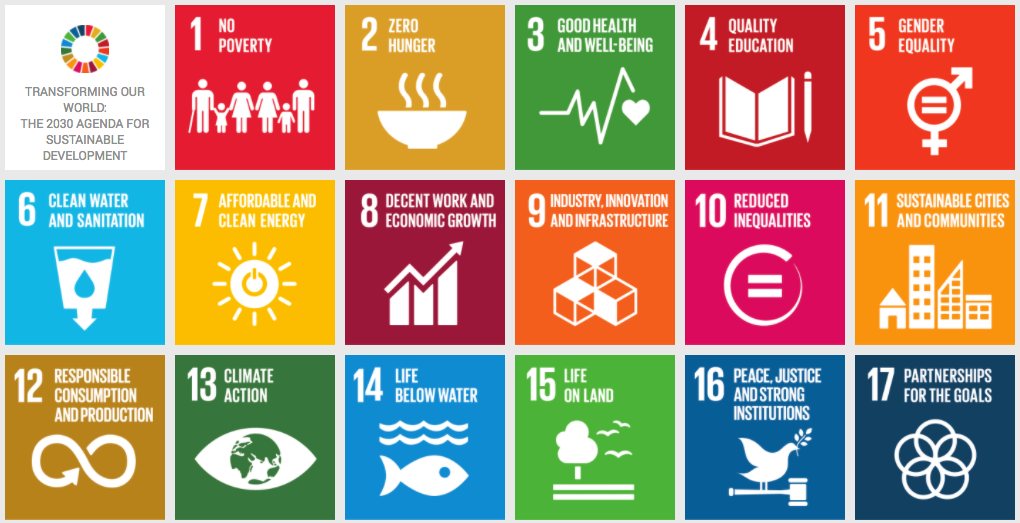
UN Sustainable Develompent Knowledg Platform Goals

Solving problems close to home

By | Creativity, Design, Strategy

It’s striking how easy it is to see other people’s problems. Other countries, other communities, other cultures all have lots of problems which seem pretty clear to me when I don’t experience them. Looking out at others provides enough distance—emotional and intellectual—to arrogantly assess what’s wrong “over there.” It’s much harder and much more relevant to focus on the problems we have closer to home. Solving these problems is much more actionable and in some ways more relevant than trying to figure out how to help people who are world’s away.

The challenge is that the problems in our own homes and neighborhoods are laden with emotion. These emotions—fear, anger, resentment—can stop us from Read More

Rules to Design By from Smart Hive

Rules to design by

By | Creativity, Design

I have given a lot of thought over the years about how to work as a designer. Designers are expected to design at least eight hours a day, every day of the week. It’s a lot. It’s a  challenge to keep up our creativity for 40 hours of design demand a week. While I managed a staff of creative people, I developed my ideas about what helped people continue to be creative day in and day out. These five rules to design by draw from the wisdom of others, as well as my experience creating every day. There are many more rules but these are five that never vary.

1. Develop your own way to create original imagery

Read More

INST-INT opening

INST-INT 2014

By | Data Visualization, Design, Just Awesome, Uncategorized

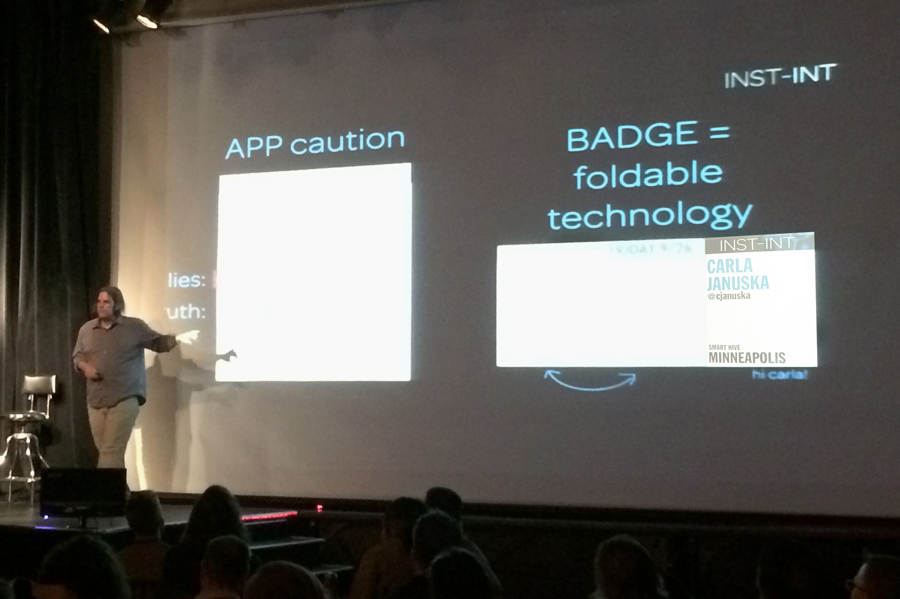
This was the first year I attended INST-INT and I was impressed with the caliber of the presentations, the feeling of community and the amazing, innovative work shown. INST-INT 2014 was a wonderful combination of the best installation, environment and immersive experience design with a focus on how it works (and when it doesn’t work), who gets involved, and how can we collaborate together. (At least 4 speakers asked for collaborators while on stage.)

It was an amazingly relaxed, collegial vibe with everyone feeling both inspired and in awe of the work shown, the efforts put forth and the multi-disciplinary talents of the speakers. Getting off the screen and into the world around us was the goal and the Read More

3D world cup data vis ball

World Cup 3D Data Visualization

By | Data Visualization, Design, Information Design

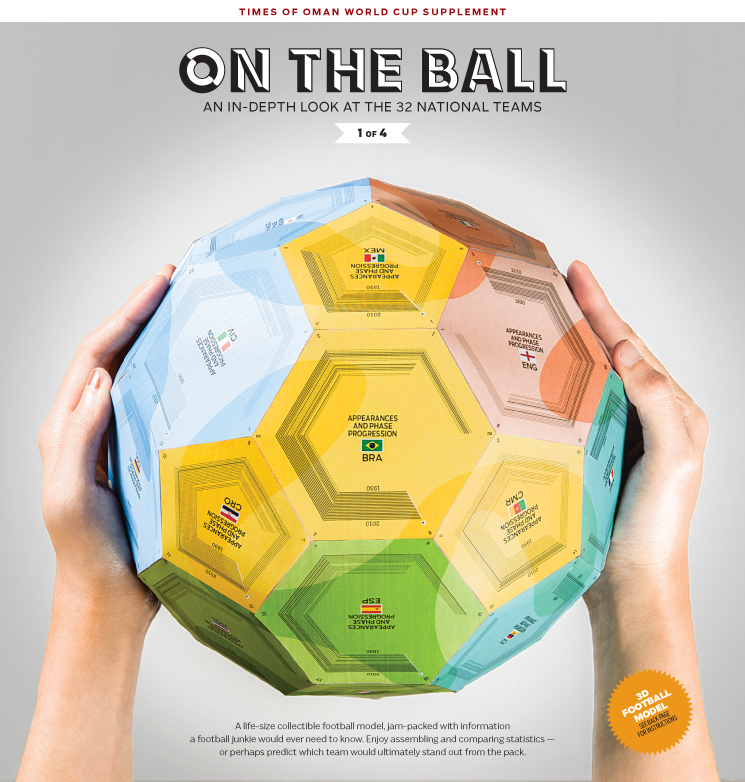
When I am talking about data, design and math all coming together in amazing ways to create data visualizations, this is what I am talking about. Check out this amazing 3D data visualization and the process to create it on Visual Loop. 

3D World Cup Dataviz Ball, by Times of Oman

While I love the data visualization itself, the process to create it is what is most insightful. Here we see the designer’s thought process, sketches, paths-not-taken and just how much data needed to be managed to create the end result. It takes a special combination of brain power and creativity to pull it all together into one accurate, engaging visualization. And we can see how many ideas and options are possible once the data is available to play with. I really admire this piece and I don’t even really care about soccer/football.