(function(i,s,o,g,r,a,m){i['GoogleAnalyticsObject']=r;i[r]=i[r]||function(){ (i[r].q=i[r].q||[]).push(arguments)},i[r].l=1*new Date();a=s.createElement(o), m=s.getElementsByTagName(o)[0];a.async=1;a.src=g;m.parentNode.insertBefore(a,m) })(window,document,'script','//www.google-analytics.com/analytics.js','ga'); ga('create', 'UA-41959290-1', 'smarthive.com'); ga('send', 'pageview');
Design Skills over time

Evolution of design skills

By | Data Visualization

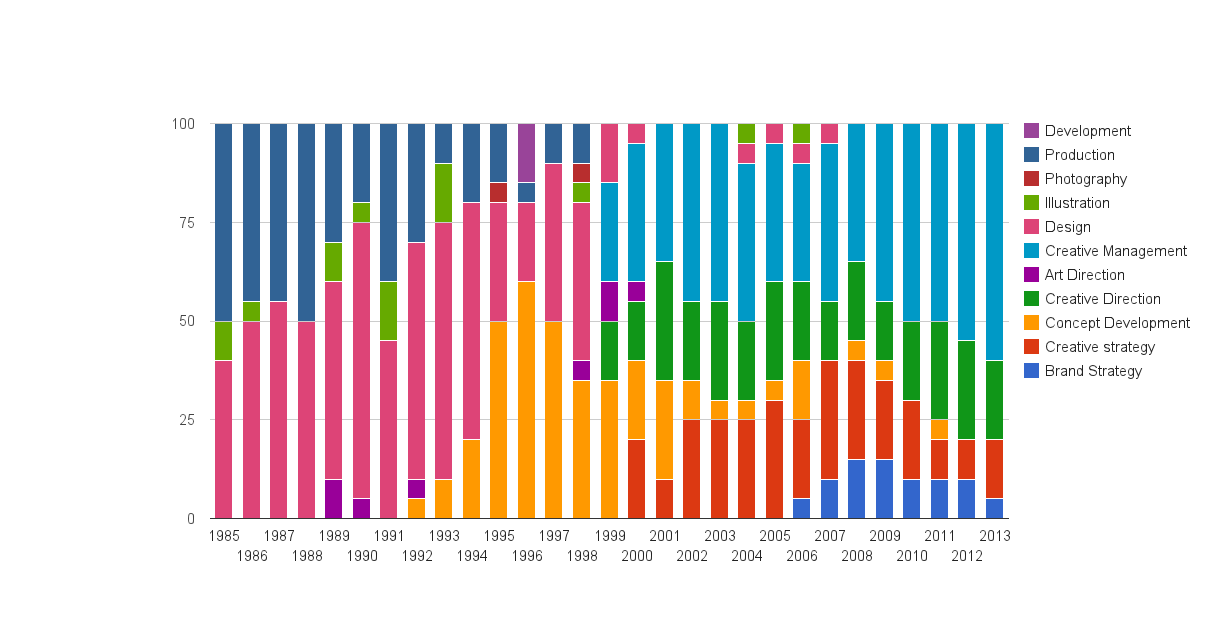
Embarking on a new path is always exciting as I move into the unknown. I’ve been adding different skill sets to my repertoire as I focus more on data visualization and information design.

However, I thought it would be insightful to look at the various skills I’ve used in my career to date as I have moved from designer to Art Director to Creative Director to Entrepreneur. The tools, processes and approaches have evolved, as have my role in the creative process. To get a sense of the progression I created this visualization that shows the design skills I used in the past 20+ years and what percentage of my time I spent on them.

Skills Visualization

As with any visualization, I gathered the data first, from my own records and memory. Then I quantified it by percentage Read More

2013 resolutions report

2013 New Year’s Resolutions Analysis

By | Data Visualization

Every year, on January 1, I make the longest list I possibly can of visions, goals, wishes, resolutions and to-do items for the new year. Last year my list had 87 items. At the end to the year I rate my progress, which you see in the stacked bar chart to the left. I’m happy with an overall progress rate of 73%.

I have 86 items on my list for 2014, so far. I have always subscribed to the quantity theory of resolution making, “the more the better.” This gives me more chances to make progress on a wide variety of places to go, things to do and people to meet. And it relieves the stress of putting all my intentions into one or two resolutions. I highly recommend writing down as many resolutions, ideas, dreams and wishes as possible. I don’t look at the list very often throughout the year, usually only when I am feeling stuck. Then I remember what I wanted my life to look like in January. It gives me a nudge to take action, which is the whole point of my new year’s list.

Happy New Year!

Data visualization is effective

What marketers believe about data visualization

By | Data Visualization | No Comments

When we asked marketers and those in related fields what they believe about data visualization we were encouraged by their responses.

First, it is clear that 75% of marketers believe data visualization is essential to effective communications. In today’s highly visual culture and crowded marketplace, visualizing data clearly can make for more rapid engagement. And while it is not the only approach to communications, certainly it is an approach that leans towards “truthiness” and believablity, both highly valued by today’s customers.

Read More

Where marketers use data visualization

By | Data Visualization | No Comments

Data visualization, as an approach to communications, education or analysis, has broad appeal and our survey showed it is already being used by marketers. Marketers use data visualization for both internal communications and external marketing efforts. In many cases they mentioned a specific audience or stakeholder they were focused on, leading us to believe that visualization is being used for targeted communications.

Read More

Where is data visualization used?

Marketers’ awareness of data visualization

By | Data Visualization | No Comments

In the fall of 2013 Smart Hive commissioned research on marketers’ awareness of data visualization. In a this and subsequent posts we’ll outline  our research findings and what we think the marketers think of data visualization.

Have you seen or heard of data visualization?

First we needed to know if marketers even knew what data visualization was and if so where they had seen it. As you can see in the results to the left, there was good unaided awareness of data visualization, with 58% of respondents having seen data visualization and 48% having heard of data visualization. The term, data visualization, may be an area of needed definition and explanation, given the overwhelming increase of awareness once we showed examples.

Read More

Excellence in cartography visualizations

By | Cartography, Data Visualization

A recent article on Visual Loop had some excellent examples of cartographic visualization. It’s exciting to see so many exciting examples of cartography visualization and so many new tools being developed that increase our options for mapping data. I am especially interested in looking at data on maps in two ways, looking at non-traditional kinds of data mapped to geography and maps that take into account large data sets and make new insights possible. Read More

carla at eyeo festival 2011

Why I started Smart Hive

By | Creativity, Data Visualization, Information Design

I decided to start Smart Hive, an agency focused on information design, data visualization and creative strategy, because I got a email. Out of the blue, in 2011, I received a promotional announcement for a conference in the Twin Cities called Eyeo Festival. I had never heard of it before because it never existed before. Dave Shroeder, founder of PilotVibe and Flashbelt, Jer Thorp, data visualist, and Wes Grubbs, founder of Pitch Interactive, dreamt up a conference focusing on the growing convergence of art, data visualization, creative code and media arts. Read More