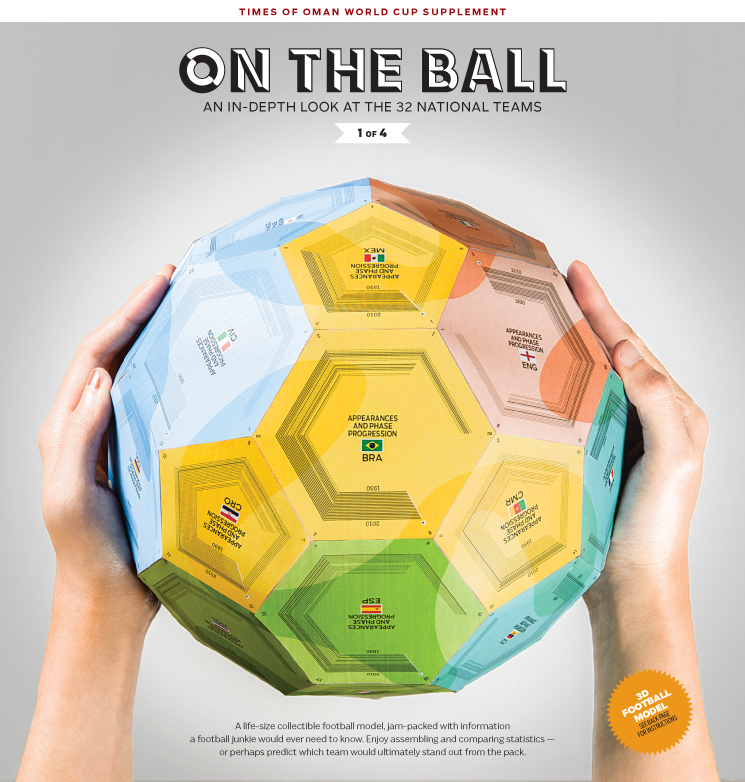
When I am talking about data, design and math all coming together in amazing ways to create data visualizations, this is what I am talking about. Check out this amazing 3D data visualization and the process to create it on Visual Loop.
3D World Cup Dataviz Ball, by Times of Oman
While I love the data visualization itself, the process to create it is what is most insightful. Here we see the designer’s thought process, sketches, paths-not-taken and just how much data needed to be managed to create the end result. It takes a special combination of brain power and creativity to pull it all together into one accurate, engaging visualization. And we can see how many ideas and options are possible once the data is available to play with. I really admire this piece and I don’t even really care about soccer/football.


